|
DebugBar Doc Tutorials Public |
New: You can now use the Forum to post bugs. On Win XP Prof, Polish edition, IE 7.0 "Wystąpił błąd w czasie wykonywania. Czy chcesz debugować? Wiersz: 687 Błąd: Arg: Fraction out of range (0 to 1 allowed)" ==> More details: http://nhw.pl/wp/2007/03/27/ie-errors-with-gpolyline-one-more-word/ We couldn't reproduce the bug on our side. If somebody else is having the same problem, please let us know ! 2. Compatibility Issue with IE7Pro (AdBlocker part) When I'm installing the DebugBar, the AdBlocker stop working... I wonder whether it is not the observation of the requests HTTP which makes doubled bloom (indeed, IE7Pro makes it possible to block some url download) We will check this problem soon... 3. This code break the code highlight String.escape=function(string) {return string.replace(/('|\\)/g,"\\$1");}} This is a known bug/limitation of our current code highlighter. We will try to fix it in a future release, but this is not a priority task so far. Thank you for the feedback anyway. 4. I installed the Beta version, i dont see anything popultaed in the HTTP(S) tab at all. Rest of the tabs work fine. IS there anything in the IE that i have to set to see the http/https information? Sometimes, IE is disabling the DBB BHO used to get the HTTP info. Check on the IE "Manage add-ons" dialog box if it is enable, and if not, enable it. This should solve the problem.  5. I have the same problem that #4: I don't see anything populated in the HTTP(S) tab. I can't use your advice, because I'm using IE 6.0 and I don't have any "Manage add-ons" stuff. Any other suggestion of what can be wrong in my IE configuration? I tested on win2000 and it is working ok. If you have some time for debugging, you can contact me directly at [email protected] so we can try to find the problem. By the way.. I should (will) set up a forum which is more suitable for bug reports and discussions than a wiki ! 6. When Companion.JS is actived, a Network Service (SVCHOST.EXE) use 100% of my CPU when it's possible (I've configured my computer to privilege programs and not system) and it make my computer slower This is a bug on the version 0.1 : The Companion.JS is trying to connect to IE as a debugger every 0.5 seconds. When the script debugging is disabled on IE, this loop is using a lot of CPU :-( We will correct this on the next version. To avoid the problem (and activate Companion.JS as well!) you can activate script debugging under IE by unchecking the 2 "disable" checkboxes in the IE internet options :  7. DebugBar icons are messed up after changing Windows theme. Tested on Win XP SP2, IE 7.  --Ricardo Good point. This is a minor bug... but I will try to correct on a future version. 8. When trying to use Companion.JS, I always see the script debugger window popping up, letting me choose if I want to debug with "Microsoft Script Editor" or "Microsoft Script Debugger". Regardless whether I say yes or no, Companion.JS doesn't receive the errors, the console stays empty. Even worse, when trying to type something into the console, the input area freezes (greyed out). Is this somehow related to Microsoft Script Editor? I have disabled all three options in the preferences, even the "Show script errors". Thanks! --Paul (paul.bakaus at gmail) Strange, It may depends on the system (I corrected a bug for this under Vista). I will contact you directly to try to correct the bug. 9. Compagnon.JS I install everything, follow all instruction but "console.xxx()" doesn't seem to be analysed !? May have someone experiment the same problem ? Here is a image : 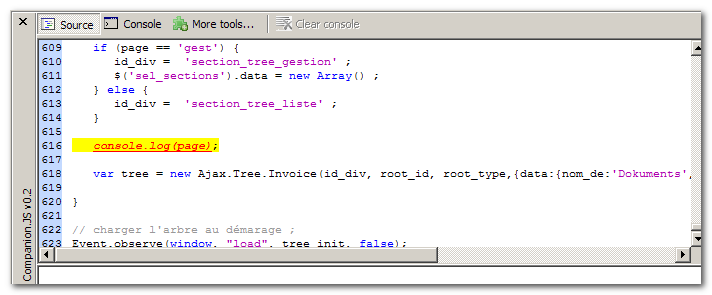 Hoppe you will found a solution ! --Frederic (frederic.klee at bluewin dot ch)
--Mark Armendariz (enobrev at gmail dot com) For me CompanionJS 0.3 correct this bug. --Frederic (frederic.klee at bluewin dot ch) 10. I have the same problem as Paul in section 8 above. I've installed CJS, unchecked the debug options, but JS errors still insist on popping up the Microsoft choices (debug or script editor). And typing anything in the console freezes up the input box. Interestingly enough, some errors do get handled by CJS, for instance on Microsoft's own Windows Update page there's a trivial error which does cause CJS to open instead of the strandard MS dialog. But 90% of errors still trigger that dialog instead of CJS. I'd love to use this product ... so any update on this issue? I'm running XP (2002), SP2, with IE7, all fully up to date. edit - PROBLEM SOLVED! It's a .NET v2 Thing. Disable "Just in Time" Debugging by firing up MS Word, go to Tools->Macro->Microsoft Script Editor. In Script Editor, go to Tools->Options->Debugging. Click "JIT Settings". Clear the checkbox for "JIT Debugging". OK the dialogs. Close Word. Restart IE. --hugh Thank you very much for the feedback ! I was trying to understand this problem for a few days so far and couldn't find any solution. I will try to setup a faq for Companion.JS for easier installation. 11. When the path of a script file includes HTTP GET parameters which contain a forward slash, the path is not rendered correctly. Instead, the path is truncated from the forward slash. Example: 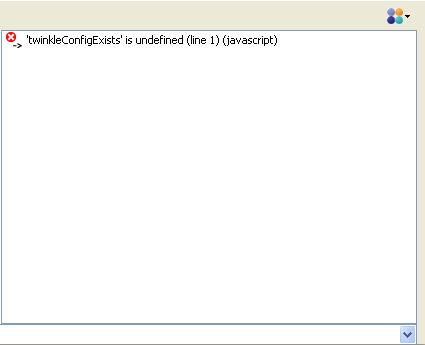 This occurs on all scripts running on MediaWiki sites, as this one was. The addresses are of the format <site>/index.php?title=<scriptname>&action=raw&ctype=text/javascript - as in the screenshot, only the "javascript" is displayed. Could you modify it so that forward slashes after a "?" character in the URL don't cause the address to break? Thanks. Post on the forum: http://www.my-debugbar.com/forum/ Hi, |

